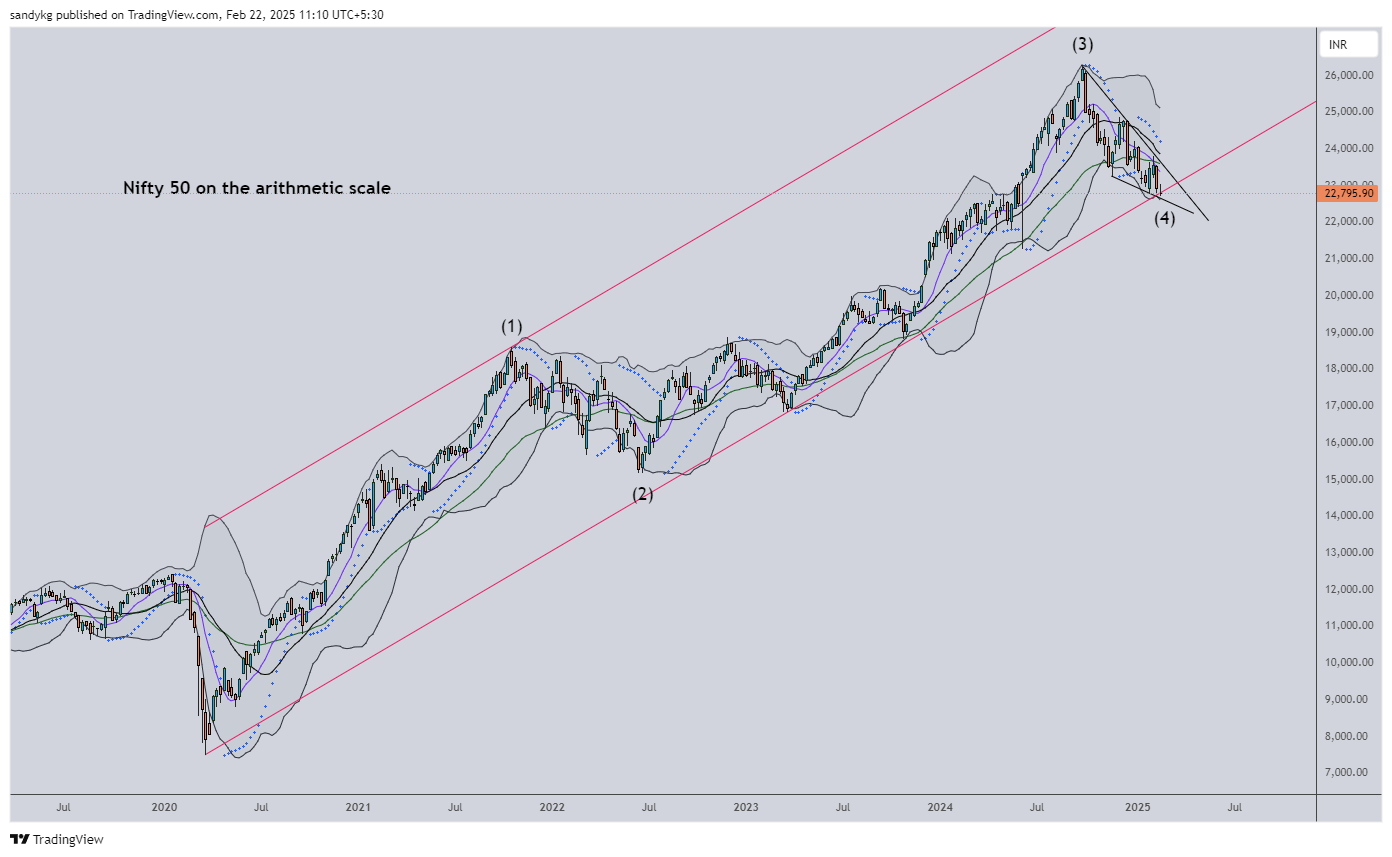
Nifty to bottom before the close of this Financial Year 2025/26 and the view is for a 18month to 2 year rally to 33,000.
Nifty from the bottom of 2020, seems to depict 3 waves up, with the 4th wave close to culminating at the channel line from the orthodox low (where sentiment was lower than the 15200 bottom.
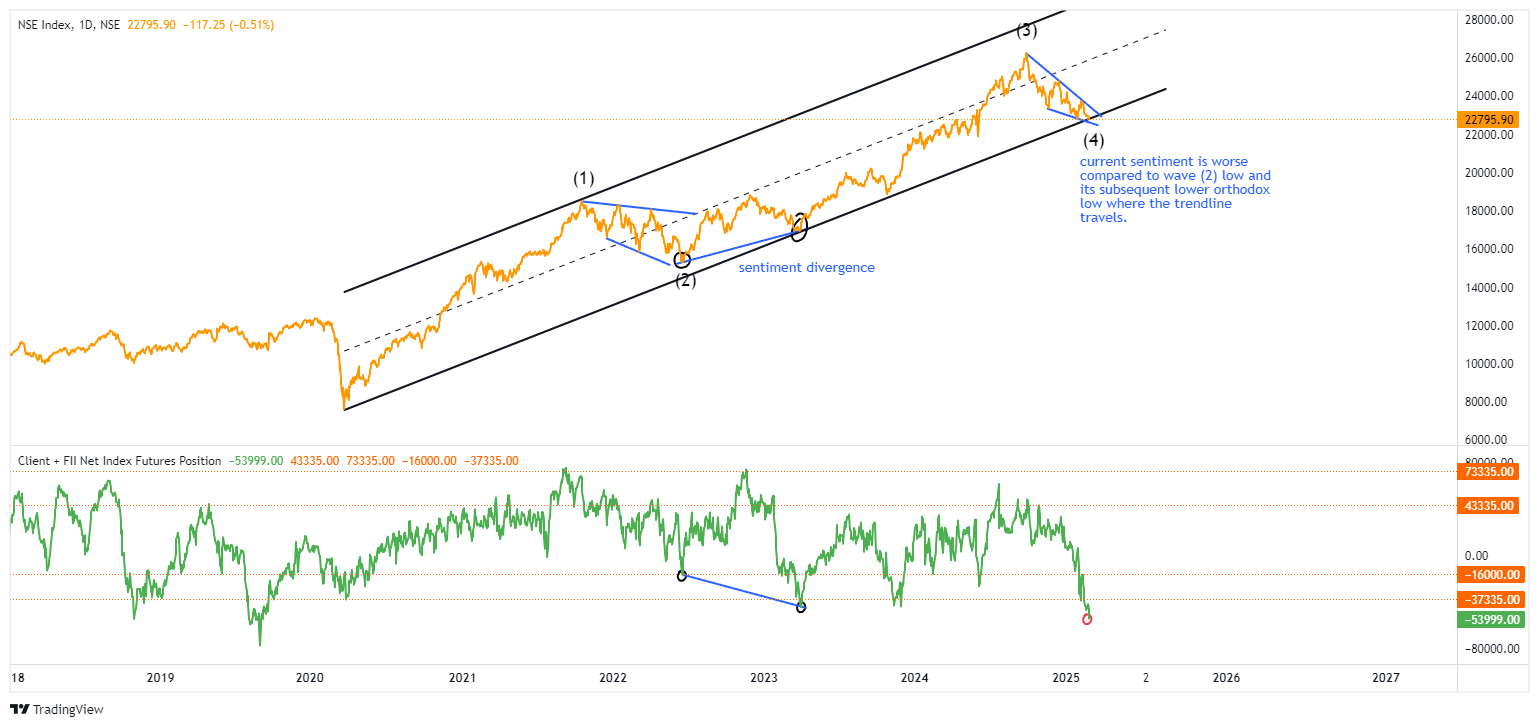
Before we move on to the wave counts, lets look at sentiment (courtesy: web.strike.money), first we will look at Client+FII Net Index Position which is at its lowest reading from the lows of the pandemic. Also as you would see the sentiment at 16,800 the orthodox low (channel) is lower than the actual low of 15,200. So if wave (5) becomes bigger than (3), the low in sentiment could be evidence for a wave count change to wave 2 of Wave (3) [basically a wave (3) subdivision].
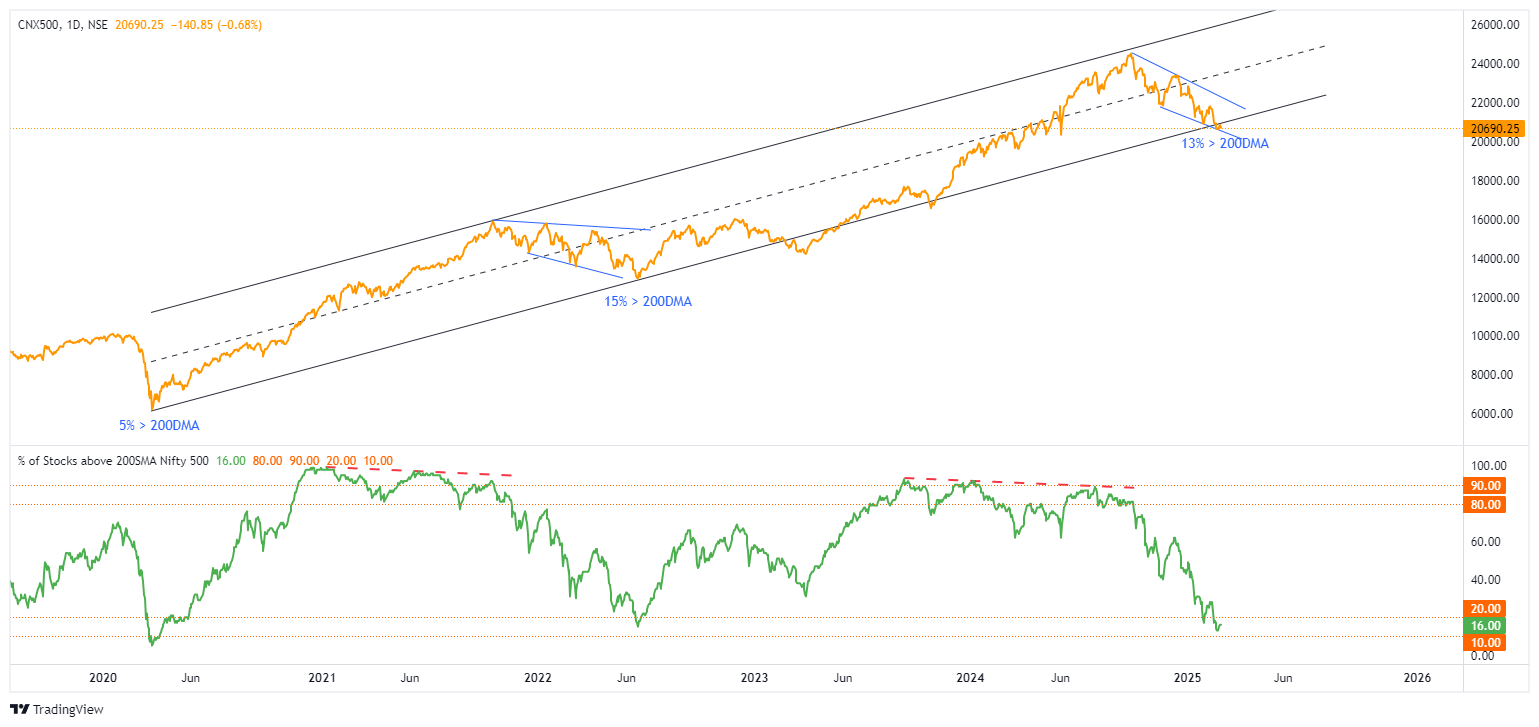
Below is the chart of Nifty 500 (going broad) and using the diffusion indicator (again courtesy strike), at tops it shows long divergences; whereas at bottoms its either small divergences or v shaped recovery. The important aspect here is that this indicator shows that only 13% of the Nifty 500 constituents are above 200 DMA, compared to 15% at wave (2) low and 5% at covid bottom. Sentiment is indeed poor and if Nifty 500 manages to come back in the channel, then the bottom should be in.
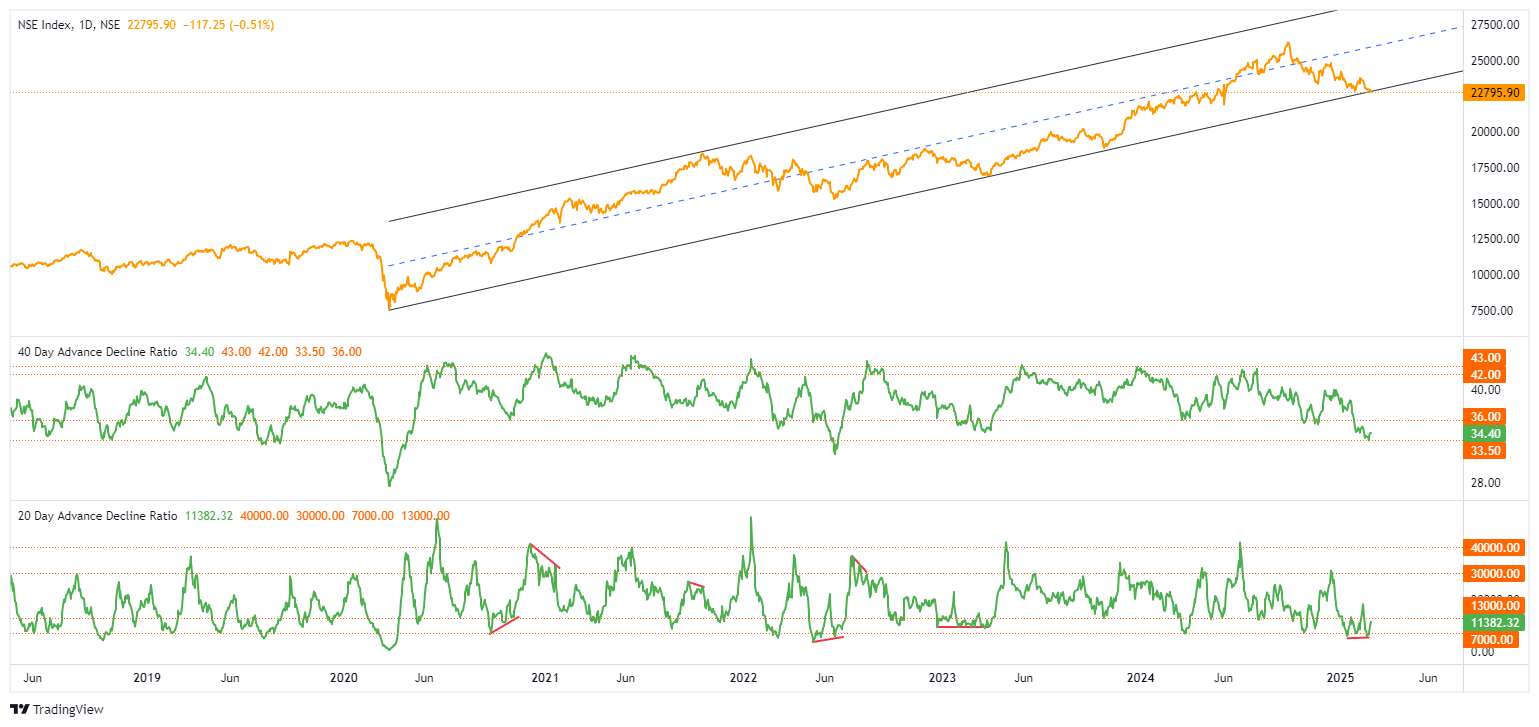
Now lets look at the AD Ratio, here they depict extreme negativity – however AD40 still has room to drop (although not necessary). However what is interesting is that on many occasions AD20 shows a divergence with AD40 before trend reversal in the underlying index. Currently, not ideal but AD20 shows a flattish line and AD40 drop quite a bit.
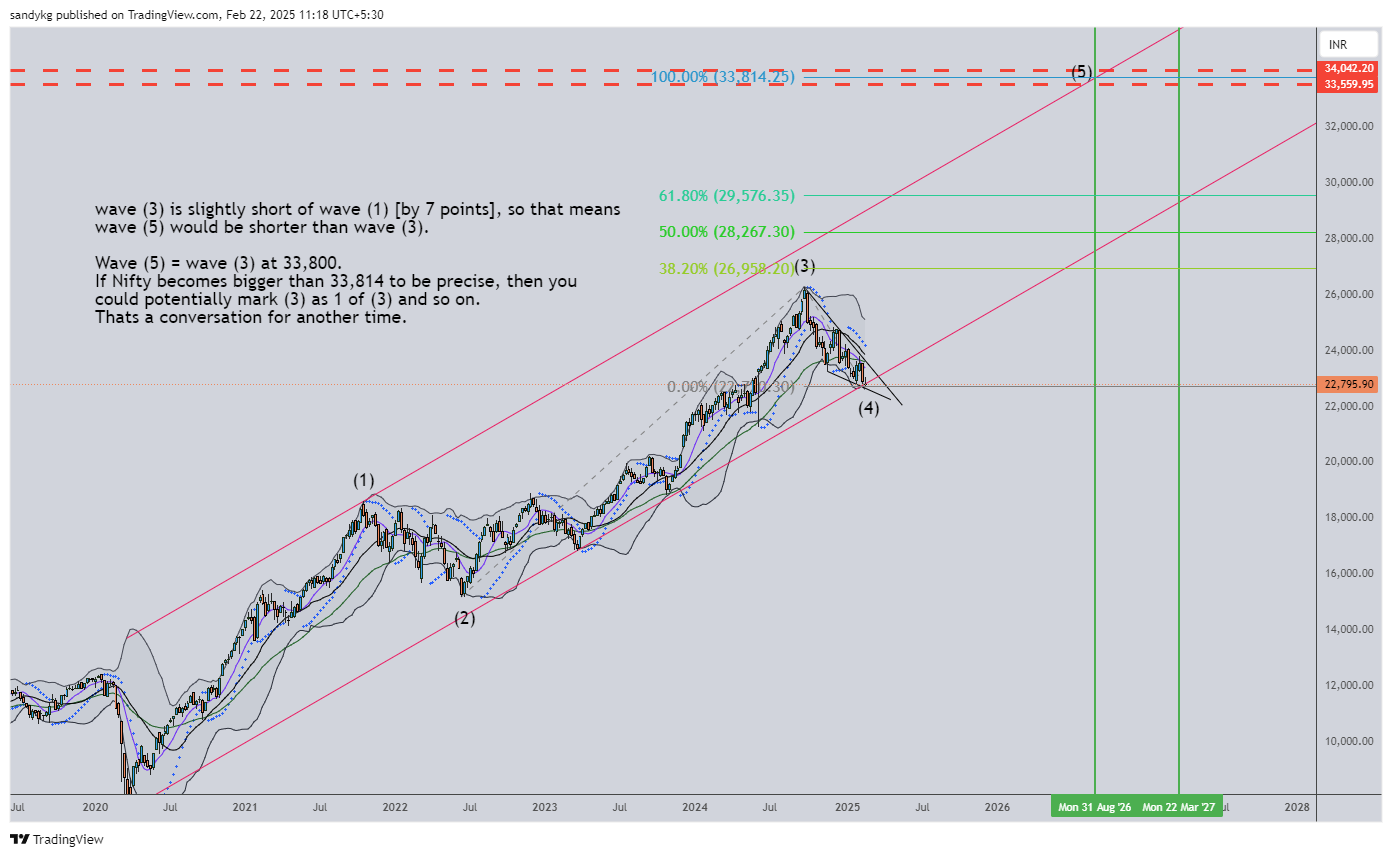
Now lets get into the wave counts. When the wave (4) ends, which it could have been this week or does so next week; we
Leave a Reply
You must be logged in to post a comment.