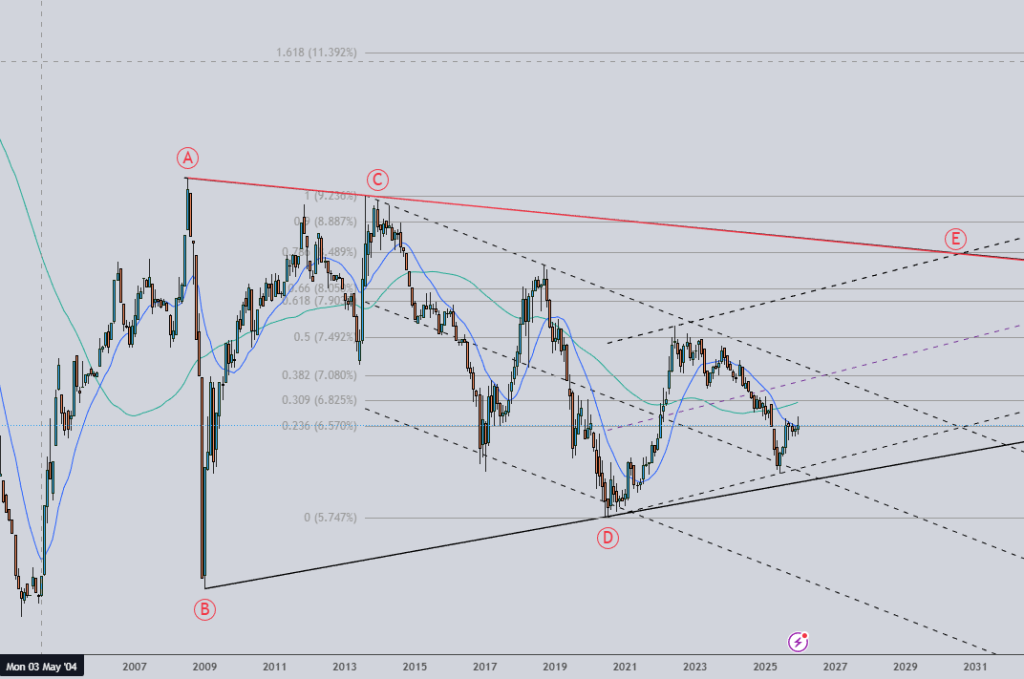
What if the yield chart on 10Y was a triangle or a complex double zig-zag correction (if 2009 lows was taken as truncated bottom).
Both indicate an increase the interest rates. A close above 6.6% on the monthly chart does not bode well for the EMI payers or industries financing debt through barely positive free cash flows. Keep an eye, and do your research where the stress lies in your portfolio.
Debt is pain when you are barely meeting the payments. Cash flow is important not just for producers but for consumers alike. If Gold remains elevated, one may see a lot of Cash-for-Gold loans to make ends meet!
Leave a Reply
You must be logged in to post a comment.